
- The nature of the data to be study with the LRM.
- The Population Regression Equation (or PRE)
- Specification of the PRE
- Assumptions about the observed variables in the PRE
- Assumptions about the unobserved disturbance term in the PRE
- The nature of the data to be study with the LRM
The simple LRM model is designed to study the relationship between a
pair of variables that appear in a data set. The multiple
LRM, which we will study later, is designed to study the relationship
between one variable and several of other variables. In both
cases, the sample is considered a random sample from some population.
The two variables, X and Y, are two measured outcomes for each
observation in the data set. For example, in our minimum wage
example, one variable would be the employment rate in a
particular location (say a province) at a particular point in
time (say January 1995) within a particular group of people
(say people between 16 and 20 years of age). The other variable
would be the minimum wage at the same location and time.
- Assumption A0 about the LRM
- The data consist of N pairs of two related variables:
![$$\hbox{Sample} \equiv \biggl[ (X_1,Y_1), (X_2,Y_2), \dots (X_N,Y_N) \biggr].$$](../images/reg104.gif)
- The Population Regression Equation (PRE) The PRE is sometimes called the Population Regression Function (PRF). The PRE is the model specified by the researcher for studying the relationship between X and Y.
- Assumption A1
- The variables X and Y are related by:
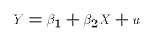
where- Y is an observed random variable (also called the endogenous variable, the left-hand side variable).
- X is an observed non-random or conditioning variable (also called the exogenous or right-hand side variable).
 is an unknown population parameter, known as the constant
or intercept term.
is an unknown population parameter, known as the constant
or intercept term.
 is an unkonwn population parameter, known as the coefficient
or slope parameter.
is an unkonwn population parameter, known as the coefficient
or slope parameter.
- u is is an unobserved random variable, known as the disturbance
or error term.
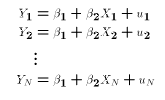
Since A0 assumes that each observation is drawn from the same population this way of writing the PRE is equivalent to (*). We will often refer to an arbitrary observation with the index .
.
- Specification of the PRE The linear equation (*) might at first appear to be very restrictive. That is, we start out our analysis assuming that X and Y are linearly related. Of course, many relationships are non-linear. Does that mean that the LRM cannot deal with them? Not necessarily.
Here is what appears to be a non-linear model:
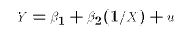
But, we could re-define the exogenous variable:
Now (E1) can be written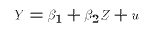
In other words, E1 can be remapped into the PRE (E2) through a transformation of the exogenous variable X. The key is that we can do the re-mapping
 without knowing the values of the
population parameters
and
.
without knowing the values of the
population parameters
and
.Here is another model that can be re-mapped in the LRM:
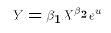
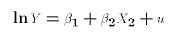
Why would we start out with such an equation? There are many reasons. For one thing, we may have an economic theory that tells us that X and Y should be exponentially related. For another thing, we may be dealing with variables that can only take on positive values. For example, the minimum wage and the unemployment rate are never negative numbers. A direct linear relationship between them allows the possibility that one could generate negative predicted values from the statistical analysis. In the case of the unemployment rate, this would be nonsense. By starting with E3 we guarantee that our model generates positive values.We can take logs of both sides of E3:
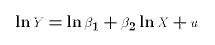
We have to keep in mind that the intercept in E4 is the natural log of the original coefficient
. We could
re-define our variables and parameters:
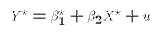
- where
-
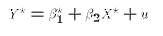


The semi-log specification is:
Here is a model that can't be re-mapped into the LRM:
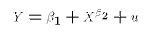
There is no way to define functions of X and Y that fit into the LRM without knowing the value of
. But the whole idea of regression is
to estimate
and
from data without knowing the value of
beforehand.
E6 is a model which would have to be estimated using
non-linear regression techniques. We will have examples of
particular non-linear models later in the term.
How to choose the
specification of the PRE is an important topic. In this class,
however, we do not focus on the question. We will instead
focus on the simpler question: given a specification of the PRE, what do
we do?Once a researcher has specified the PRE, there are two types of statistical procedures that can be performed on the PRE:
- Estimation:
How do we get a "good" estimates of
and
?
What assumptions about the PRE make a given estimator a good one?
- Inference:
What can we infer about
and
from sample
information? That is, how do we form confidence intervals
for
and
and/or test hypotheses about them.
[regress Contents] [Next File] [Top of File]
This document was created using HTX, a (HTML/TeX) interlacing program written by Chris Ferrall.
Document Last revised: 1997/1/5