
- The Joint Cumulative Distribution of X and Y
is defined as F(x,y) = P(X < = x & Y < = y)
- F(24,100) = 1
- all students study less than 24 hours a day and all have averages less than or equal to 100
- F(0,0) = 0
- no students study less than 0 hours and have averages less than or equal to 0.
- Joint density of X and Y is defined as
f(x,y) = Prob( X= x & Y = y) [discrete]
and f(x,y) = d² F(x,y) / dxdy [continuous]
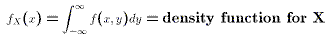
- The marginal density function for X
is
- X and Y are (statistically) Independent if and only if
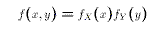
for all values of x and y
for all values of x and y
- Joint Expectations:
Given a joint density function f(x,y) and a function
g(x,y) that is a function of the two random variables
X and Y, the expected value of g(x,y) is defined as
![$$E[g(x,y)] \equiv \int_{-\infty}^{+\infty}\int_{-\infty}^{+\infty} g(x,y)f(x,y)dxdy$$](../images/glo016.gif)
- Examples of joint expectations:
- The mean of one of the random variables
can be written using the joint density function:
![$$E[Y] = \int_{-\infty}^{+\infty} \int_{-\infty}^{+\infty} yf(x,y)dxdy = \int_{-\infty}^{+\infty}yf_Y(y)dy.$$](../images/glo294.gif)
- This is the case where g(x,y) = y.
- Covariance is defined as E[ (X-E[X])(Y-E[Y]) ]
Covariance extends The notion of variance to two dimensions. Its value measures the linear relationship between r.v. Positive covariance indicates that when X is above its mean then Y tends to be above its mean as well - positive statistical relationship. Negative covariance indicates that when X is above its mean Y tends to be below its mean - negative statistical relationship
- Correlation between two random variables (
 ) is
defined as
) is
defined as
![$$\hbox{corr}(X,Y) \equiv {\hbox{Cov}[X,Y] \over \sqrt{Var[X]Var[Y]} }$$](../images/glo019.gif)
(
is a common synonym for corr).
- This is the case where g(x,y) = y.
- Properties of Covariance
- X and Y independent
 Cov[X,Y] = 0
- Cov[X,Y]
- If X and Y are normal random
variables then
Cov[X,Y] = 0
X and Y independent.
Note that Cov[X,2Y] = 2Cov[X,Y], so a simple linear change in the random variables will increase or decrease the size of their covariances. Correlation avoids this scaling effect.
- Properties of Correlation

- Cov[X,Y] = 0
corr[X,Y] = 0
(Zero covariance is the same as zero correlation)
- If X and Y are linear functions of each other, then |corr[X,Y]| = 1.
- corr[aX,bY] = corr[X,Y]
The absolute value of corr[X,Y] measures the degree of linear relationship between them. The sign of corr[X,Y] indicates whether there is a positive or negative relationship between X and Y. Unlike covariance, correlation is unaffected by the scaling of the random variables by constants.
- Example of Joint Distribution
- Let X take on the values 1, 2
- Let Y take on the values 0,1
f (x) f(x,y) 0 1 X -------------------- 1 | 0.1 | 0.3 | 0.4 |_________|__________| | | | 2 | 0.4 | 0.2 | 0.6 --------------------- f (y) 0.5 0.5 1.00 Y- Confirm the following
- Let Y take on the values 0,1
- E[X] = 1.5
- E[Y] = 0.4
- Var(X) = 0.25
- Var(Y) = 0.24
- X and Y are not independent
- E[X | Y=0 ] = 1.8
- E[Y] = 0.4
- You can get as much practice as you want with this kind of example by running the tutorial for week 2.