This outline uses the 2012 blue-and-green Queen's University custom edition of the textbook.
We shall use chapters 1-8, with a few omissions listed at the bottom of this page.
The additions in the last column are pdf additions to the textbook, so be sure to save (and perhaps print) a copy of these for studying.
| Week and Topic | Chapter | applets | Additions |
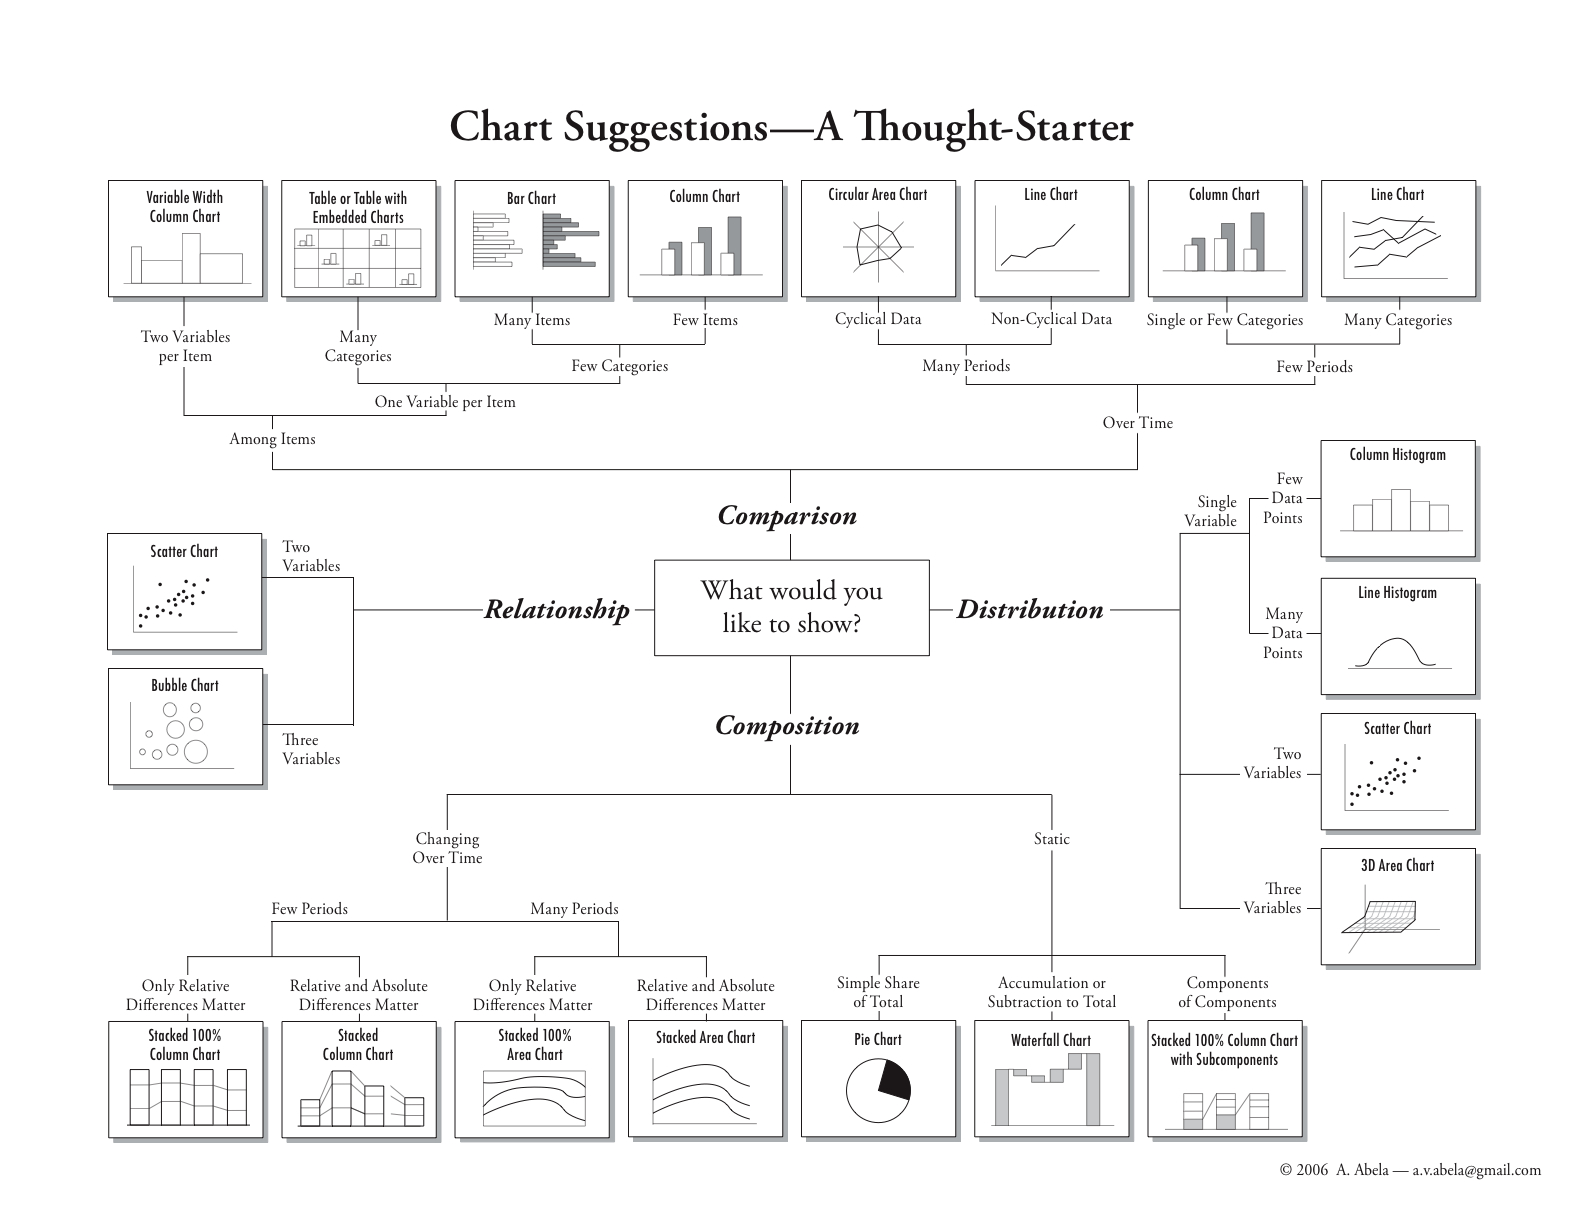
| 1. graphs and sample statistics | 1.1-1.2 | onevar, meanmedian | chart choice, mode, weighted mean, grouped data |
| 2. normal densities, scatter plots, | 1.3, 2.1-2.2, 2.5 | normalcurve, gapminder, twovar | uniform density, covariance |
| correlation, two-way tables | |||
| 3. samples, experiments | 3 | randomsample | |
| 4. probability | 4.1-4.2, 5.1-5.2 | probability | counting, summation, coefficient of variation |
| 5. random variables | 4.3 | ||
| 6. binomial distribution | 5.3 | binomial calculator/grapher, clt_binomial | |
| Reading Week | |||
|---|---|---|---|
| 7. sampling distributions | 4.4 | simulation, lawoflargenumbers, clt_samplemean | |
| 8. inference | 6 | confidenceinterval, testsignificance | |
| 9. inference (continued) | 6 | statsig, pvalue, power | |
| 10. inference for means | 7 | ||
| 11. inference for proportions | 8 | ciprop | |
| 12. least-squares regression | 2.3-2.4 | correlationregression, twovar | What is Econometrics? Rhinelander Regression Notes |
| Topic | Pages | |
| assessing normality | 54-57 | |
| Poisson distributions | 319-324 (section 5.4) | |
| the bootstrap | 346-347 | |
| optional topics in comparing distributions | 439-445 (section 7.3) | |
| relative risk | 480-481 |
Back to the main Economics 250 page ...