b. In order to produce output of 2200 in 2001 (given A is constant from
2000 to 2001), the amount of K that is required is determined by the
following equation:
c. The output in 10 years time, assuming productivity remains unchanged,
will be:
d. To show that doubling the inputs K and N will exactly double output, we
multiply each variable by 2 and calculate:
We can see that the production function is homogeneous of degree one because this property is true for any number, i.e. X=2, 3, 100, etc.
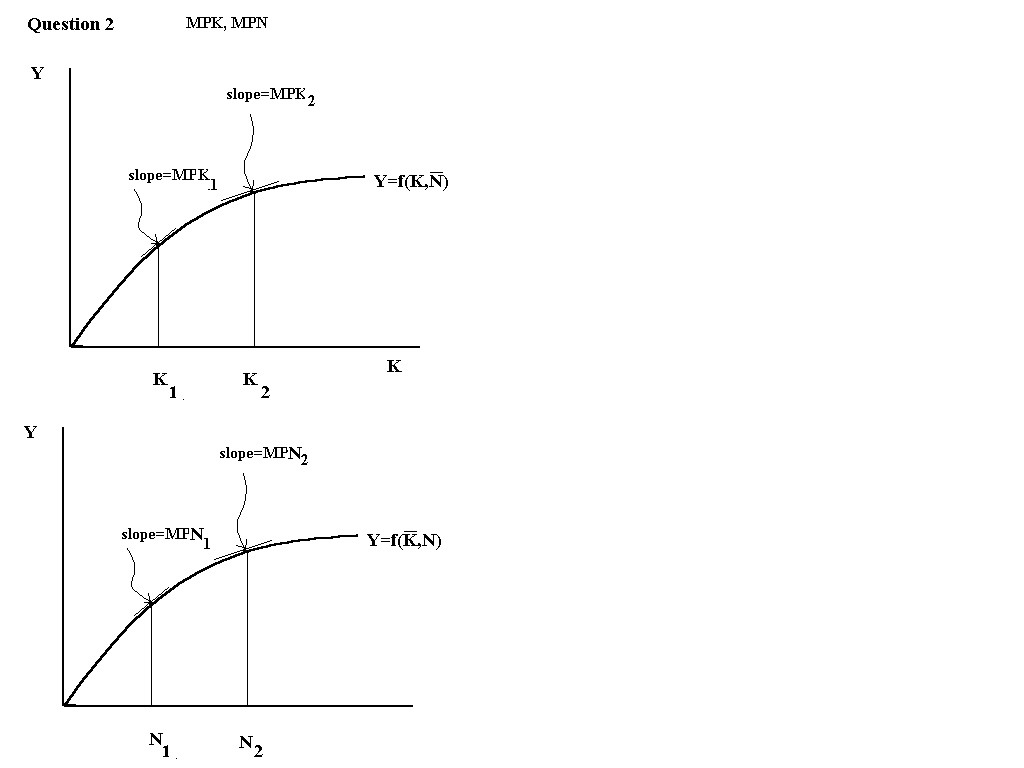
Q2. MPK is the increase in output from one unit increase in capital. In
other words, it is the slope of the line tangent to the production
function at any given K. Note: MPK decreases as K increases.
MPN is the increase in output resulting from one unit increase in labour
input. In other words, it is the slope of the line tangent to the
production function at any given N. Note: MPN decreases as N increases
a. Supposing the production function exhibits diminishing returns to
scale then two properties of the MPK function are: (1) MPK decreases as K
increases, (2) MPK is positive for all K.
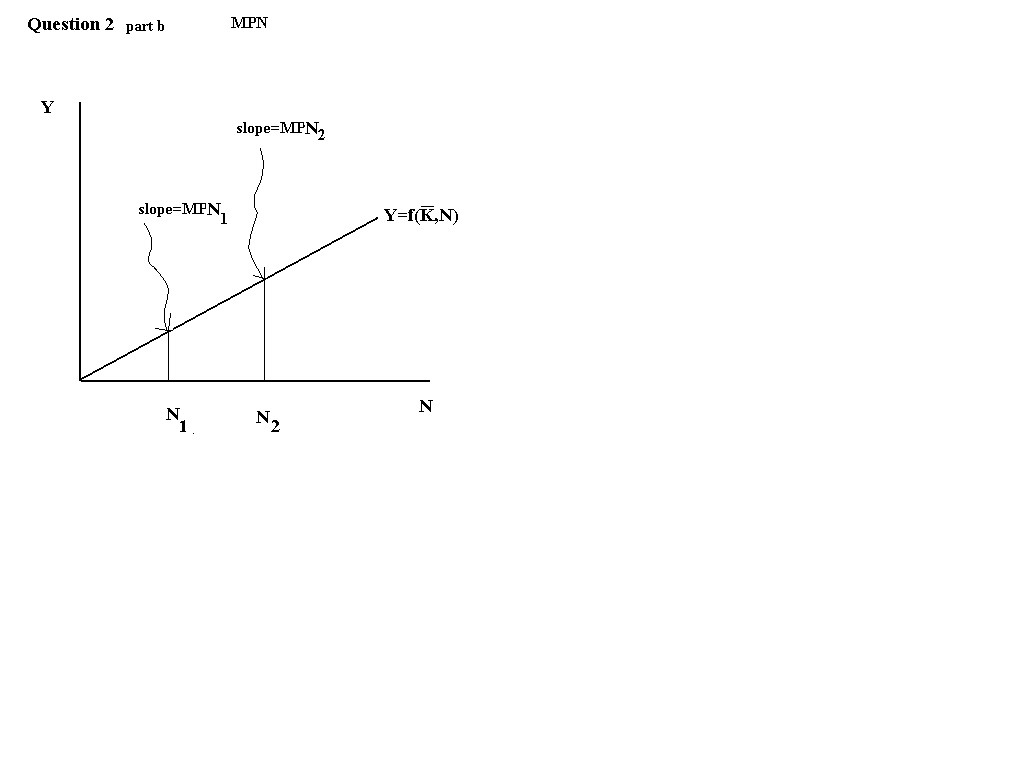
b. Supposing the production function exhibits constant returns to scale
(in N), then the properties of the MPN function are: (1) MPN remains
constant as N increases, (2) MPN is positive for all N
Q3.
a. Firms wish to set MPN=w and labour supply must equal labour demand
in equilibrium, so we can find N and w in the following manner:
Demand for labour is found where MPN=w
{other valid answers include: w=1500/[5+10(1-t)] or
w=300/[1+2(1-t)] }
b. when t increases we see that:
c. If t=0.5 then we can calculate w and N as follows:
If a minimum wage is set at 200 employment will decrease and there will
exist involuntary unemployment:
Nd= 2000-5w = 2000-1000 = 1000
d. If a technological shock changes MPN to 400-0.5N we can see that at any
level of N the marginal productivity of labour is lower after this shock.
Thus, it is an adverse technological shock.
Now the firm will recalculate MPN=w to get a labour demand curve as
follows:
given the minimum wage of 200 this means that:
Q4
Desired capital stock is that amount of capital stock that allows a firm
to earn the highest amount of expected profit. Because a lag often occurs
in obtaining and installing new capital, firms compare the expected
future marginal product of capital MPKf with the user cost of
capital, where user cost of capital is the expected real cost of using a
unit of capital for one period. Firms maximize profit by buying capital
until MPKf = User Cost; that is, as long as the benefits
(MPKf) exceed the costs (User Cost) of purchasing one more unit
of capital, firms will purchase that unit, until such time as the benefits
exactly equal the costs. Graphically:
a. A technological improvement will increase MPKf for any given
K, but will not change the user cost of capital; therefore, a
technological improvement will increase the amount of capital stock
desired. Graphically:
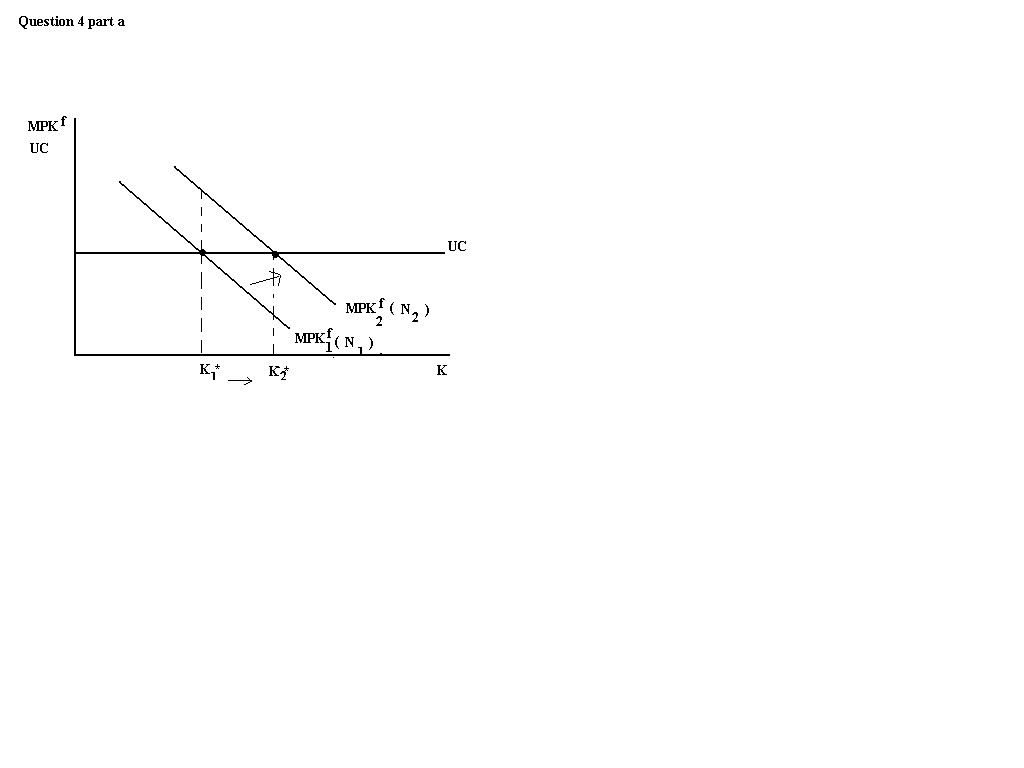
b. An increase in N due to increased immigration will increase
MPKf for any given K, but will not increase the user cost of
capital; therefore, an increase in immigration will increase the amount of
capital stock desired. (note: there was a typo in the
assignment, N was ommitted by accident so full marks are awarded where
this caused confusion) Graphically:
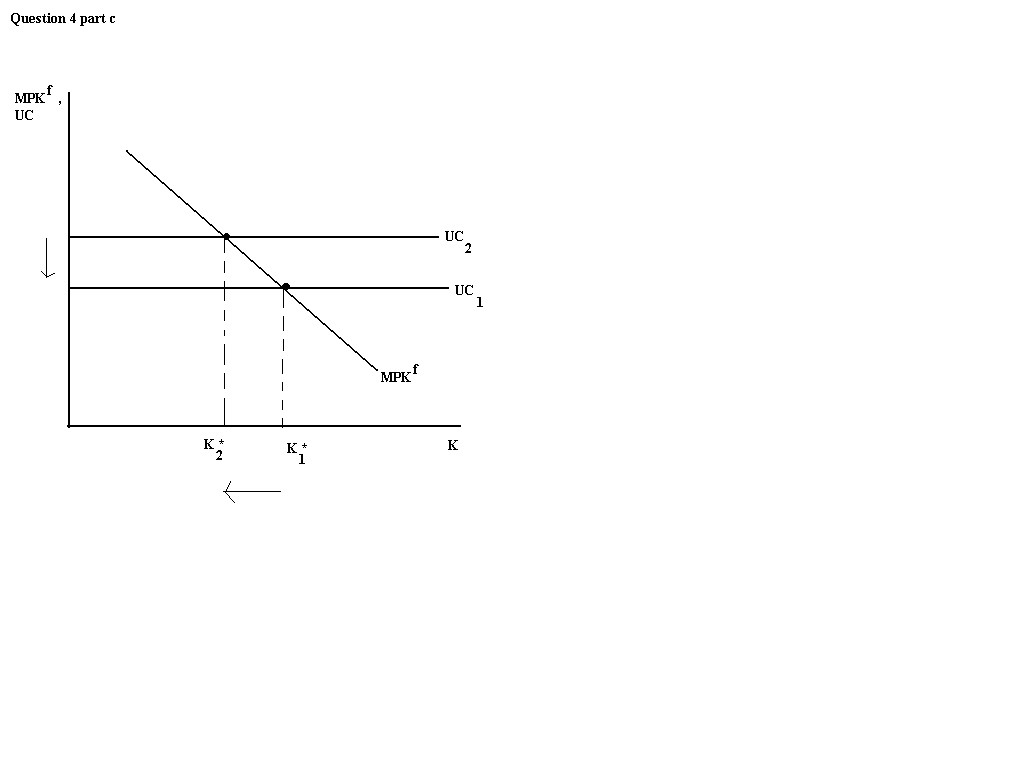
c. An increase in the real interest rate will increase the user cost of
capital. UC=Pk(d+r) where d=depreciation and r=expected real
interest rate.
Thus, an increase in r means and increase in UC. Therefore, an increase
in r will decrease the amount of capital stock desired.
Q5. Given current and future MPK=10000-2K+N, current and future
MPN=50-2N+K,Pk=$5000, r=0.1, d=0.15, and w=$15,
a.The user cost of capital is: UC
from (2)K=2N-35 sub this into (1) to get:
1250=10000-4N+70+N
so K = 2(2940)-35 = 5845
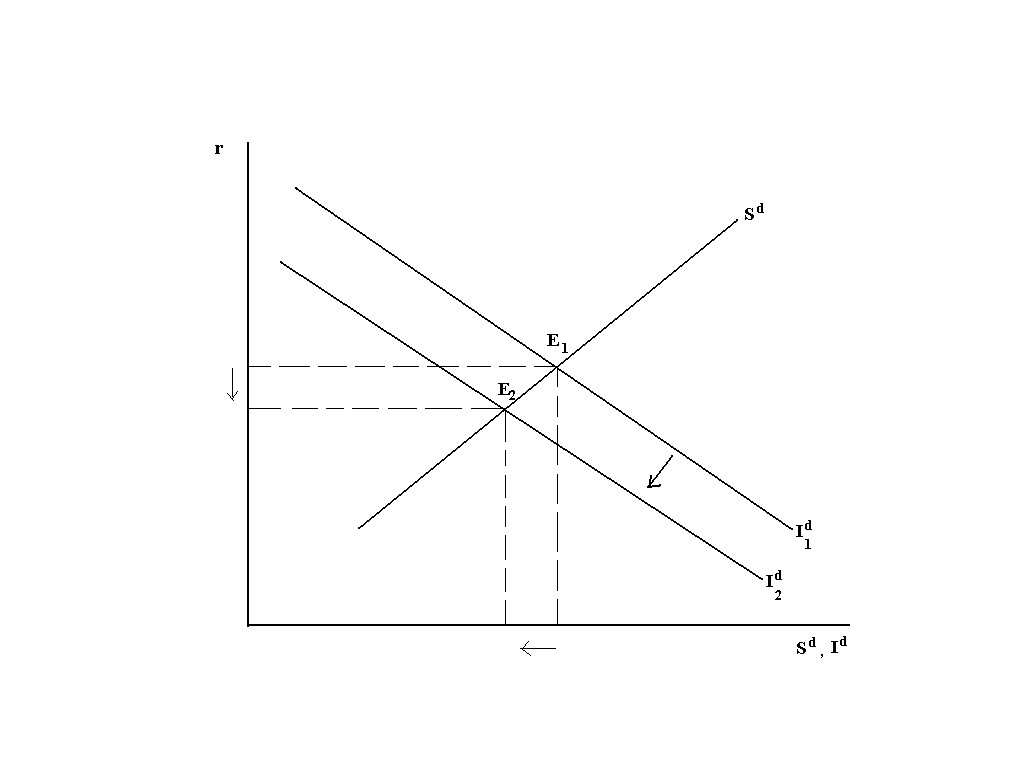
Q6. The equilibrium condition in the goods market is:
Graphically:
Note that: Id is downward sloping. This slope is because as r
increases the user cost of capital increases so the desired amount of
capital stock decreases and therefore Id decreases.
a. Ricardian equivalence implies that the timing of temporary tax changes
doesn't affect desired consumption or desired national savings. Thus, an
increase in the income tax rate will not shift Sd, nor will it
shift Id, and as such, there will be no change in the goods
marked equilibrium from and increased income tax rate.
b. A temporary decrease in government spending will cause Sd to
shift right. Sd=Y-Cd-G, so for any given r, a
decrease in G implies that Sd is higher. The goods marked
equilibrium will shift right and down, yielding a lower equilibrium r and
a higher equilibrium Sd,Id.
c. An increase in tax on a firm's revenue will increase the user cost of
capital:
(note: if you see τ in any of the above equations it means that your
browser does not support the current code. Wherever you see τ there
should be a lower case greek letter tau in its place.
Q7. Given full employment output = 5000, G=0,
Cd=3000-2000r+(0.1)Y, and Id=2000-4000r
a. The equilibrium values of r, Id, and Cd can be
found in the following manner:
Sd= Y-Cd-G = 5000-Cd-O
In equilibrium Sd=Id, so we have
Id= 2000-(4000)(0.083)= 1666.67
Cd= 3000-2000(0.083)+(0.1)(5000) = 3333.33
b. If government spending, G, increased from 0 to 1000 we can calculate
the new values of r, Cd and Id as follows:
Sd=Y-Cd-G
At equilibrium Sd=Id, so:
Id = 2000-(4000)(.25) = 1000
Cd = 3000-(2000)(.25)+500 = 3000
Intuitatively, as government spending incrases disposable income decreases
which causes savings to decrease, because savings decreases then at any
given r the amount desired to be saved will be lower, so in order to raise
the necessary capital for investment, for any level of investment, firms
will have to pay a higher r. At higher r the user cost of capital is
higher and firms will desire a lower amount of capital stock; hence
investment will be lower. Graphically
so 400-0.2N = w
so:
set supply=demand:
so N=2000-5(150/(1.5-t))
and w(1-t)=150(1-t)/(1.5-t)
(1.5-t) decreases so 150/(1.5-t) increases, in other words, w
increases.
Also, 2000-150/(1.5-t) decreases, so N decreases.
To see the effects on w(1-t) is more complicated. We determine the effect
on after tax wages by taking the derivative of w(1-t) with respect to t
and obtain:
This number is less than 0 for all t.
{Other valid answers include a
simple explanation of how increases in t will affect w(1-t), the
derivative method is not necessary}
So we see that an increase in t decreases after tax real wages.
Ns= 500+10(1-t)(w) = 500+1000 = 1500
So employment will be 1000 and 500 people will be involuntarily
unemployed.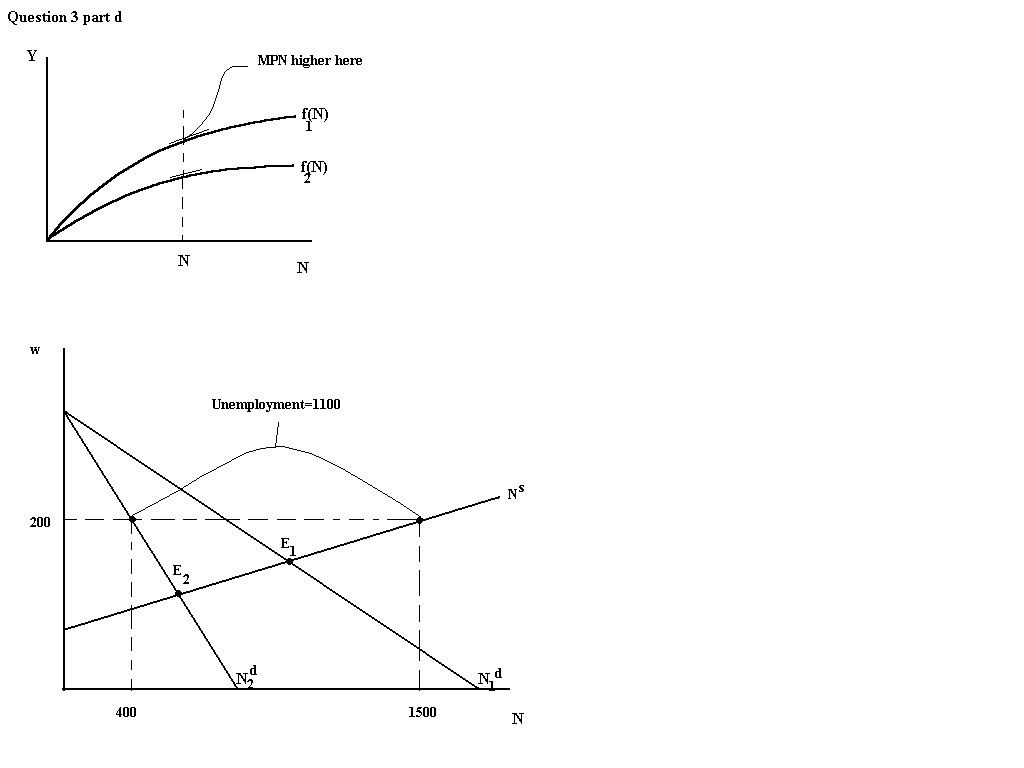
Nd = 400/0.5 - w/0.5 = 800-2w
Nd = 800-400 = 400
but since Ns=1500 still, we have an increase in involuntary
unemployment resulting from the adverse technological shock coupled with a
minimum wage. Employment now is 400 and unemployment is 1100.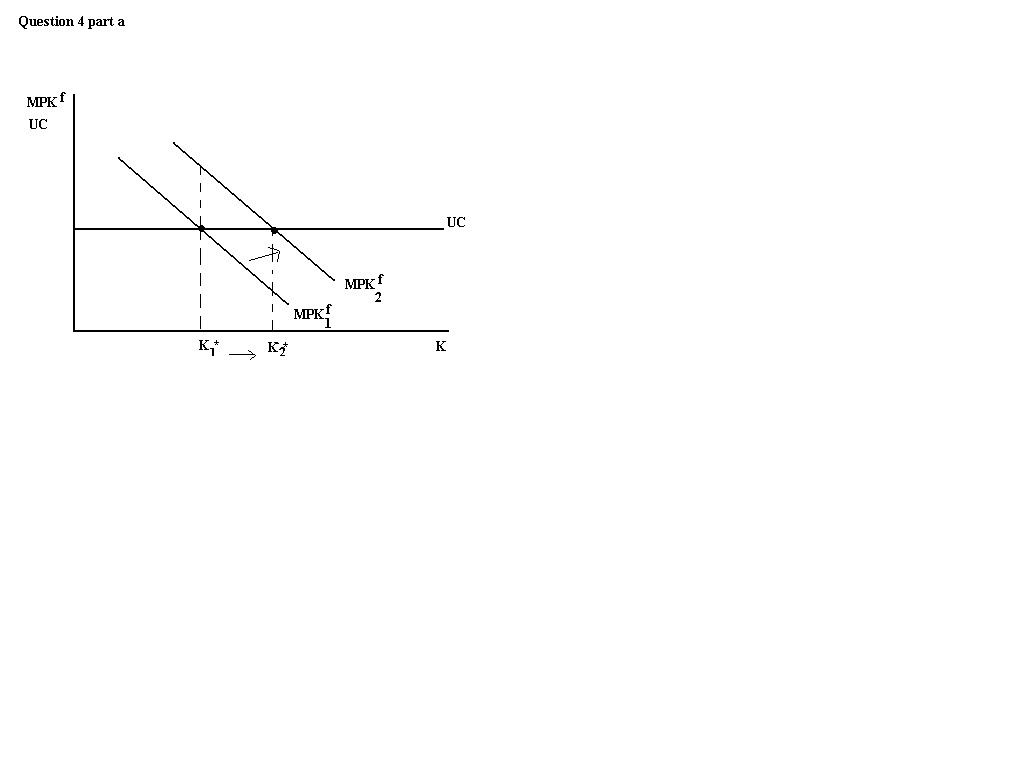
(1)UC=1250=10000-2K+N
(2) w=15=50-2N+K
so 3N=8820
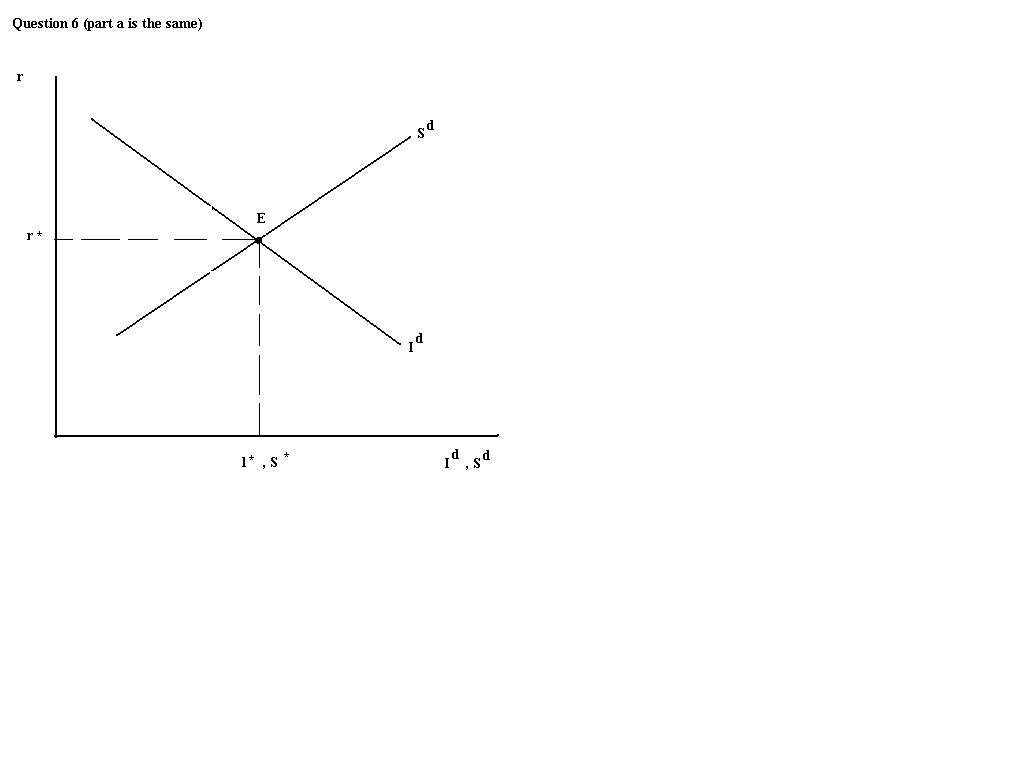
Sd is upward sloping. This is because as
r increases the rewards to saving increases so people wish to save more (a
counter effect is that as r increases you need to save less in order to
earn the same amount in the future, but empirically it is shown that this
second effect is dominated by the first effect).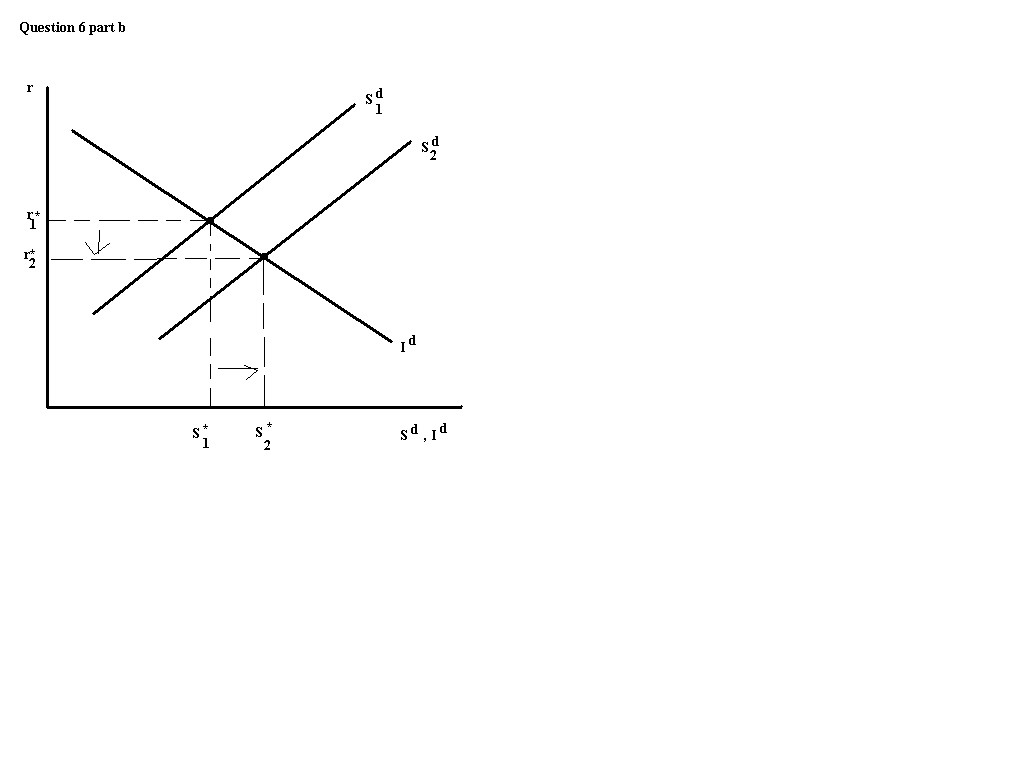
(1-τ)MPKf=(r+d)Pk
so MPKf=Pk(r+d)/(1-τ)
which increases as τ increases. Graphically: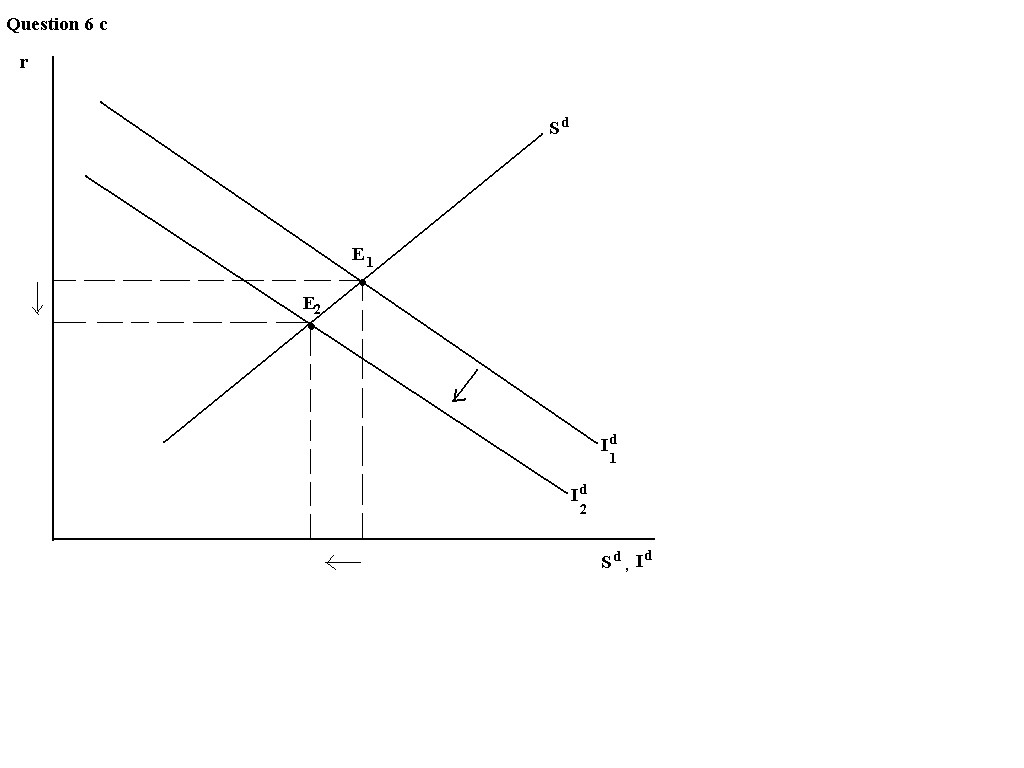 Thus Id is lower for any given r (the Id curve
shifts down) and the goods market equilibrium shifts down and to the left.
So the new equilibrium r is lower and the new equilibrium Sd,
Id are lower.
Thus Id is lower for any given r (the Id curve
shifts down) and the goods market equilibrium shifts down and to the left.
So the new equilibrium r is lower and the new equilibrium Sd,
Id are lower.
Sd= 5000-3000-2000r-(0.1)(5000) = 2000-4000r =
Id
r= 500/6000 = 0.083 or 8.3%
= 5000-3000+2000r-(0.1)(5000)-1000
= 500+2000r
500+2000r = -4000r +2000
6000r = 1500
so r = 0.25