HOMEWORK #2

    Deadline: (initial: Friday, Feb. 14; final: Monday, Feb. 24).
    Marking scheme:  See syllabus

    Post your assignment on your homepage. Make sure the file on your homepage is called hw2.doc or hw2.pdf in your www/ec360 directory.  If you are worried about people copying, post your assignment before the deadline (so we can check the last modification of the file), but don't use the publish command until the day after the deadline.  (Without running the publish command other people won't be able to access your assignment. If in doubt, check if you can access the file through the web at link http://qlink.queensu.ca/~your_id/econ360/hw2.doc or http://qlink.queensu.ca/~your_id/econ360/hw2.doc).

    Introduction

    Your goal in this assignment is to explore empirically rates of return to BA and MA degrees based on Vaillancourt.   You will redo parts of his analysis but also consider some possible implications of self-selection into degrees and majors.  Finally, you have the opportunity to study student loan policy.

    Imagine as the reader of your report someone familiar with the Vaillancourt paper, but who doesn't mind being reminded now and then of what Vaillancourt did.

    Elements Replicated:
        Public Returns to BA degrees (Social Science or Commerce) or a further MA degree for men and/or women
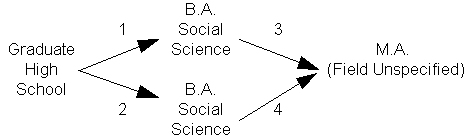
        There are four possible investment decisions shown here:

    Elements Altered:
    Define earnings as wages+salary+self-employment
         Use 'quartile' regression estimates instead of (mean) regression estimates
    Include people with 0 or negative earnings

    Elements Extended
    Allow 'opportunity cost' quartile to differ from the benefit quartile.  This leads to 9 different possible assumptions about opportunity costs as shown here:

        Total number of possible IRR: sex x degree x major x benefit quartile x opp. cost quartile = 2 x 2 x 2 x 3 x 3 = 72.   Report 3 or 4 of these possible IRRs, choosing them to tell a story. For example, hold sex, degree, and major constant but choose different quartiles to study. Then you would be telling a story about how people with different earnings potential fare when taking more education. Or, fix the quartiles and degree but vary sex and/or major. Then you would be telling a story about how returns to a degree differ by sex and/or major, given earnings power. In short there are many different stories.

    Suggested Template for your Report
     

    1. Introduction (3 or 4 paragraphs)

    2.     Pattern after Vaillancourt, modified for your report
    3.  Replication/Extension of Vaillancourt
      1. Analytical Framework & Data Sources (2-3 paragraphs)
      2. Discussion of IRR for selected sex, decision, quartiles (3+ paragraphs + tables and/or graphs)
    4. Student Loans
      1. Discuss how a student loan program affects the education decision when viewed as an investment. Do some research on student loans in Canada. Can you find statistics about loans, defaults, current policy proposals, etc.  (anywhere from 1 paragraph to 2 pages)
    5. Brief Summary (2 or 3 paragraphs)
    6. Tables and/or Graphs
     
    Steps to Perform
     
    1. Start a Qprofile / Econ 360 session.  These files will be automatically installed on the computer and ready to use:
    2. hw2.ado
      a Stata program that I've written to replicate Vaillancourt
      ec360hw2.dta
      Data drawn from the Public Use Micro Data File for the Census of Canada 1986 (data set # 426). Starting from 495,467 observations I selected observations meeting these criteria:
      • Age between 17 and 65
      • High School Degree (and no further education), Bachelor's, or Master's
      • If Bachelor's is highest degree then major is either social science or commerce
      • The result is a working sample of 59505 people. A summary of data in ec360hw2:
        -> sexp = female
                              |         highest degree
         major field of study | high sch   bachelors    masters |     Total
        ----------------------+---------------------------------+----------
        social sciences and r |         0       2234          0 |      2234
                              |     26010          0       1884 |     27894
        commerce              |         0        953          0 |       953
        ----------------------+---------------------------------+----------
                        Total |     26010       3187       1884 |     31081
        
        -> sexp = male
                              |         highest degree
         major field of study | high sch   bachelors    masters |     Total
        ----------------------+---------------------------------+----------
        social sciences and r |         0       2611          0 |      2611
                              |     19862          0       3685 |     23547
        commerce              |         0       2266          0 |      2266
        ----------------------+---------------------------------+----------
                        Total |     19862       4877       3685 |     28424 
        
        
      ageprf.dta
      An auxillary data file which is used to generate the predicted age profiles.
    3. At the Stata prompt, enter hw2  Choose investment(s) to analyze.
    4. Read the output of the into a spreadsheet (several ways to do this very easily).
    5. Use Vaillancourt's reported costs of  university degrees and his assumptions about work during school to adjust the wage profiles put out by hw2.  Use the spreadsheet to compute the (public) IRRs for your selected decisions.
    6. Discuss and interpret your results.
    7. Discuss the issue of subsidized student loans using the material covered in this class as suggested above.
    8. Write your report and save it either as a Microsoft Word document (.doc) or as a PDF file (.pdf) in your www/econ360 directory. Make sure the file is called either "hw2.doc" or "hw2.pdf".